01 Jan 2021
A placeholder post for my forthcoming blog explaining the development of The Grey Viz, a Tableau visualisation where I look at the sentiment of the songs that went into creating Danger Mouse’s remix record The Grey Album.

In the meantime, you can view the completed visualisation here by clicking the link below:
29 Dec 2020
I’ve updated my webpage to use Github Pages & Jekyll using a customised version of the Hydeout theme.
For the past 15 or so years, I’ve been using the database-driven Wordpress system, but I’ve been quite frustrated with it for some time. At some point Wordpress, theme-designers in particular, pivoted away from it being a simple tool used to write and publish to a tool seemingly targetted at graphic designers and portfolios. Newer Wordpress themes have always frustrated me.

I wanted something that would serve text and images and not much more. Github Pages serves this purpose, doesn’t use a database nor any fancy bloated plugins and also is free. That’s all I need.
So, welcome to the new iteration of my webpage. This should become darraghmurray.com at some point soon.
10 Sep 2020
•
Data
•
Visualisation
I presented at September 2020 Brisbane Tableau User Group alongside Mark Jeffrey from Griffith University and Ronak Mathur, the President of QUT Business Analysis and Data Science Club.
I presented some of the background to the visualisation I presented at the Virtual Refugee Conference in June 2020.
Thanks to Frederic Fery and Key Data for inviting me to speak.
06 Sep 2020
•
Data
•
Iron Quest
•
Visualisation
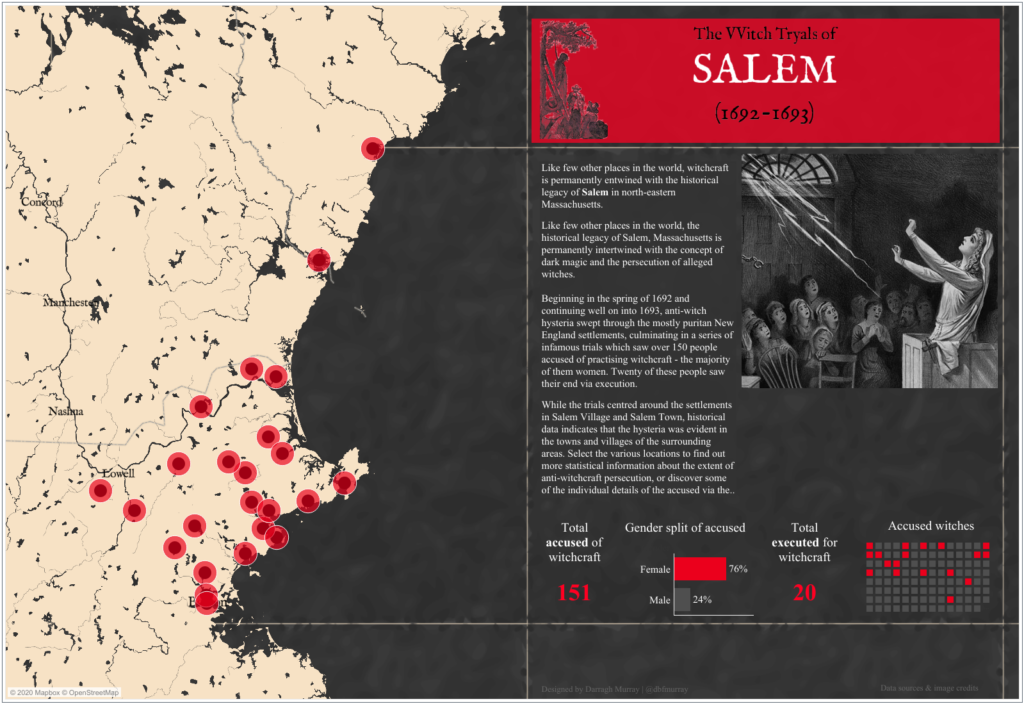
Below is the link to my latest Tableau Public visualisation mapping the locations of people accused of witchcraft during the Salem Witch Trials in late 17th century New England.
More details to follow soon.

19 Aug 2020
•
Data
•
Visualisation
•
VizForSocialGood
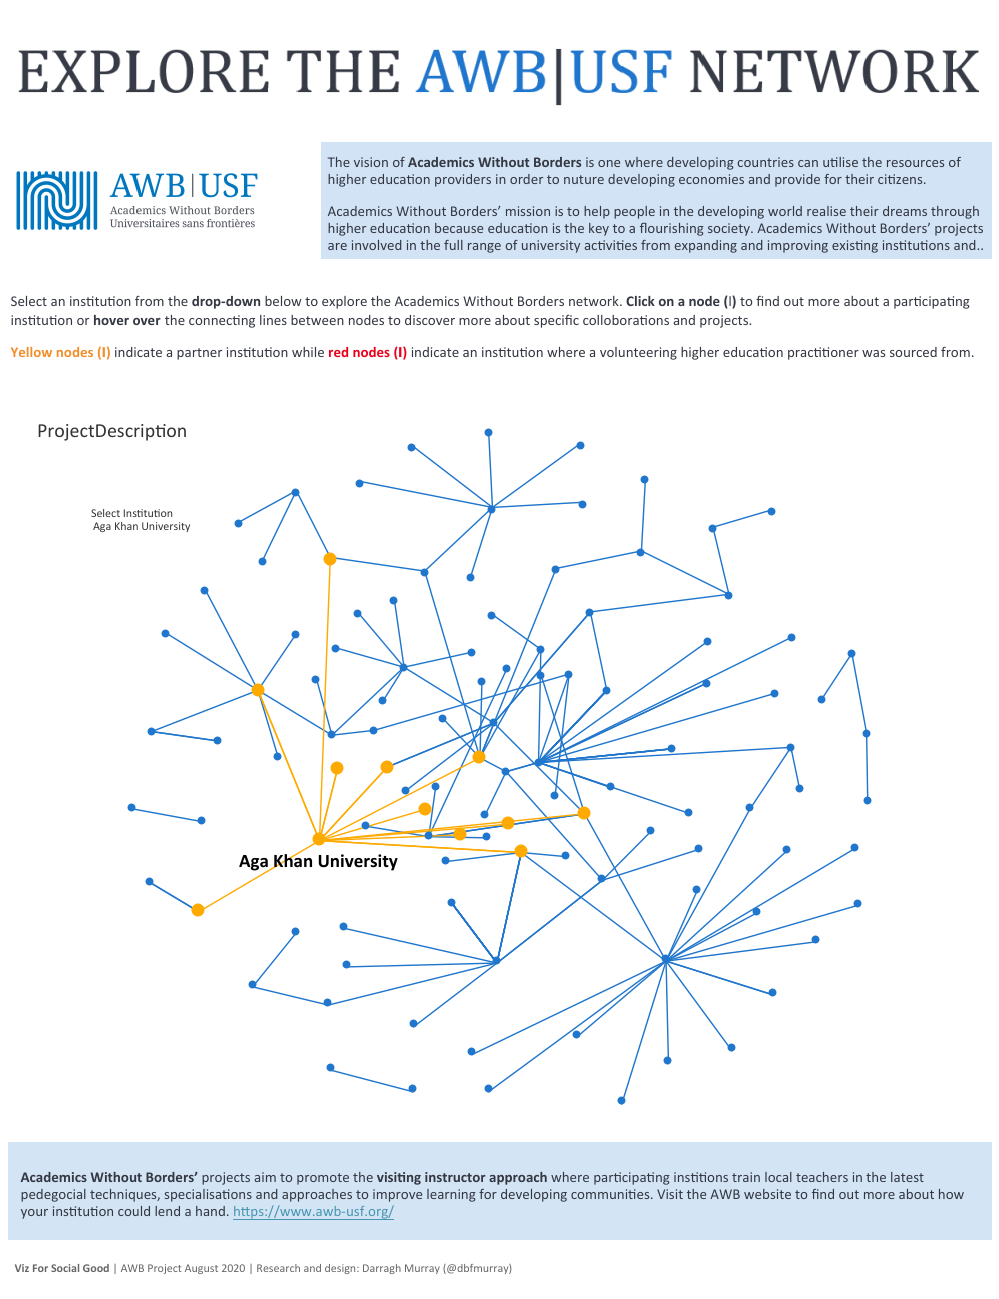
I was a late submission to the latest #VizForSocialGood round but I did manage to finish off a visualisation that made extensive use of an interactive network diagram.
I’ll be writing much more about how I did this in the near future and will update this post. Want to give a quick shout out to this very helpful tutorial by Christopher Conn of The Data Surfers which this visualisation shares heritage with.
Click on the image below to link through to the viz on Tableau Public!


